What processed foods do Indians buy?
There have been rising concerns over the increasing consumption of industrially processed foods in low- and middle-income countries. These foods often increase the overall dietary content of sugars, saturated and trans-fat, salt and dietary energy density while decreasing the content of protein, dietary fibre and other micronutrients, and therefore contribute to a higher risk of obesity and cardiovascular diseases. Detailed evidence on dietary habits of processed foods is crucial for policy makers to tackle malnutrition in these countries where undernutrition remains a severe problem.
Our paper “Purchase trends of processed foods and beverages in urban India”, published in Global Food Security, analysed take-home purchase patterns and trends of processed foods and beverages in urban India from 2013 to 2017. We found that beyond dietary staples, such as oils or processed wheat, the per capita take-home purchases of processed food and beverages are relatively low and infrequent. For example, on average, less than half (46%) of households reported a quarterly purchase of soft drinks. In 2013, the level of take-home purchases of soft drinks was only 1.29L per capita, which was much lower than the average per capita annual sales of 20.9L in lower middle-income countries in 2012. Sweet snacks, salty snacks and edible oils were the main categories of foods where volume of purchases have increased over the five years. If these rising trends in snack and oil purchases continue, with no further changes in the consumption of other foods, the dietary risks among urban Indian households will change with the potential for higher prevalence of overweight.
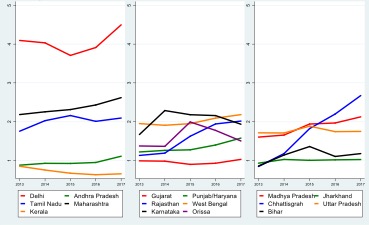
When looking at the purchase patterns at state level, the volume of processed food and beverage purchases was generally the highest in Delhi. For instance, the annual per capita purchase of sweet snacks in Delhi (4-4.5kg) was twice the level of other states (1-2.5kg). Overall, our analysis showed substantial variations in the purchase level of processed foods and beverages across states as well as variability of trends within states over time. Unlike most states, Kerala displayed a declining trend in its per capita annual purchases of sweet snacks. The message from this is that a one-size-fits-all national picture is unlikely to be sufficiently informative for nutrition-related policy making in India.
This paper used a demographically representative dataset from ‘Kantar – Worldpanel Division, India’ on take-home purchases of processed foods and beverages by urban Indian households from 2013 to 2017. It consists of 78,320 unique households across five years. We estimated the per capita purchases of eight distinct categories of processed foods and beverages in each period, namely sweet snacks, salty snacks, soft drinks, milk, dairy products, edible oils, processed wheat and ‘other processed foods’ (which predominately consists of noodles). Each group has at least one million purchase records. One key caveat is that the data excludes purchases made for out-of-home and on-the-go consumption. However, for comparable food groups, our purchase estimates in 2013 are generally consistent with those obtained from the latest round of National Sample Survey (2011-12), the official government survey on food expenditures in India.
C Law, R Green, S Kadiyala, B. Shankar, C. Knai, K A Brown, A D Dangour, L Cornelsen,
Purchase trends of processed foods and beverages in urban India,
Global Food Security, 2019, https://doi.org/10.1016/j.gfs.2019.05.007